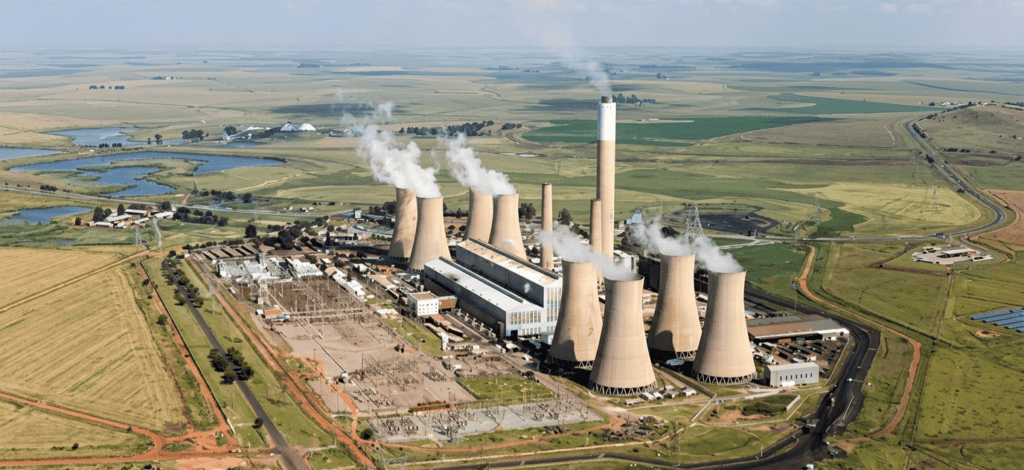
Eskom’s recent operational results deserve to be taken at face value, because they are genuinely hard to achieve. The utility has now gone 476 consecutive days without loadshedding. Its year-to-date Energy Availability Factor has climbed to 67,79%, the highest level in six years, while unplanned outages have fallen to 19,47% of capacity, down 7,52 percentage points on the same period last year. Diesel expenditure on emergency open-cycle gas turbines has fallen 81,64% year-on-year, from R5,93 billion to R1,08 billion, and Eskom now reports holding 6 220 megawatts in cold reserve rather than scrambling to find capacity [1]. For anyone who worked in Eskom’s generation business, this is a real and credible turnaround, and it should be recognised as such.
Alongside that achievement sits a separate question, not a criticism of it, about the economy the improved fleet is now serving. Statistics South Africa’s July 2026 release recorded a 7,9% year-on-year fall in the volume of electricity generated in South Africa, even as electricity distributed to consumers fell by only 2,6%, with the difference covered by a 21,6% rise in imports and a 39,6% fall in exports over the first seven months of the year [2]. Set beside Eskom’s own reporting of rising, not falling, plant availability over the identical months, this is worth understanding for what it actually shows: the recent decline in generation volumes is not a story about the reliability of Eskom’s fleet. Eskom’s own operational data is the clearest evidence, and it is data the utility should be glad to have on record.
Eskom’s FY2026 annual results, for the year ended 31 March 2026, point to where the explanation more likely sits. Sales volumes fell 6,2%, to 178 terawatt-hours, which Eskom itself attributed to weak industrial demand, embedded self-generation and energy efficiency gains, with industrial demand alone down 9,7 terawatt-hours, or 22,5%, year-on-year. Eskom’s own summary noted that “with excess production capacity, sales retention and growth are critical areas of focus going forward” [1]. Read together with the more recent weekly figures, the picture across FY2026 and into the first months of FY2027 is consistent: a fleet performing better than it has in years, meeting a smaller call on it, because two of South Africa’s largest electricity-intensive industries are producing less.
The second quarter GDP release supports that reading. Mining fell 3,0% and manufacturing 1,8% quarter-on-quarter in the three months to June 2026, the two largest negative contributors to a 0,2% overall GDP contraction [3]. Both industries are electricity-intensive, and Eskom’s own attribution of weaker sales to industrial demand aligns with exactly those two sectors pulling back. The Northern Cape, whose economy leans on manganese and iron ore mining, saw electricity delivered to the province fall 29,1% year-on-year in July, the sharpest provincial decline reported, alongside, though not proof of, the GDP release’s naming of manganese ore and iron ore among the largest negative contributors to the quarter’s mining decline [2] [3].
One part of this picture is genuinely open rather than settled. Why imports rose, and exports fell over the same months that Eskom reports spare capacity is not something the data assembled here resolves. It may reflect ordinary commercial trading decisions across the Southern African power pool, relative pricing between domestic and imported electricity, or bilateral arrangements unconnected to adequacy. It would take Eskom’s or NERSA’s own trading and export licensing data, not the aggregate Stats SA figures, to say more than that with confidence, and it is better to name that gap than to fill it with a plausible-sounding guess.
The value in setting these two sets of results side by side is not to weigh one against the other. They answer different questions, and South Africa needs both answers at once. Eskom’s numbers show that the operational turnaround, hard-won after years when the opposite numbers dominated every headline, is holding and, on the most recent evidence, still improving. The StatsSA numbers show that part of the comfort this creates is coming from weaker industrial demand, not only from the fleet. That distinction matters for what comes next. South Africa’s coal fleet still faces a wave of retirements moving into the 2030s, and margin created by an industrial slowdown is not the same as margin created by new capacity coming online. A system that looks comfortable today, for reasons that include softer demand from mining and manufacturing, tells us less than it might appear to about whether replacement capacity will be ready once that fleet actually retires.
None of this diminishes what Eskom has achieved over the past two and a half years. Because the operational recovery is real, the demand-side question deserves attention on its own terms, rather than being read as a challenge to it. The two are not in tension. Recognising both, the turnaround that has delivered 476 loadshedding-free days and the industrial slowdown that has quietly widened the margin behind it is what a clear-eyed reading of South Africa’s electricity position in September 2026 actually requires.

Matshela Koko is a former Chief Executive of Eskom (2016-2017) and Managing Director of Matshela Energy. He is a doctoral candidate at the Graduate School of Business Leadership, University of South Africa, where his research develops the Cliff Intensity Index, a diagnostic framework for measuring the velocity mismatch between coal retirement and renewable integration.
The full working paper, “South Africa’s 2030 Electricity Capacity Cliff,” is available at https://doi.org/10.2139/ssrn.5794522.
References
[1] Eskom Holdings SOC Ltd. Eskom reports second consecutive profitable year as turnaround strategy execution strengthens operational recovery, energy security and financial sustainability. Media statement, 31 August 2026. https://www.eskom.co.za/eskom-reports-second-consecutive-profitable-year-as-turnaround-strategy-execution-strengthens-operational-recovery-energy-security-and-financial-sustainability/. Weekly system status update figures (67,79% year-to-date EAF, 19,47% UCLF, 81,64% diesel expenditure reduction, 6 220MW cold reserve, 476 consecutive days without loadshedding) from Eskom media statement, 4 September 2026 [URL not independently verified in this session; confirm exact link on Eskom’s Media Desk before publication].
[2] Statistics South Africa. Electricity generated and available for distribution (Preliminary), July 2026. Statistical Release P4141. Embargoed 3 September 2026. https://www.statssa.gov.za/publications/P4141/P4141July2026.pdf
[3] Statistics South Africa. Gross domestic product, quarter ended June 2026. Statistical Release P0441. Embargoed 8 September 2026. https://www.statssa.gov.za/publications/P0441/P04412ndQuarter2026.pdf